

Supergas Intelligence Dashboard
Experience · Interface
An operations dashboard that brings key figures, charts and detailed records into a shared view.
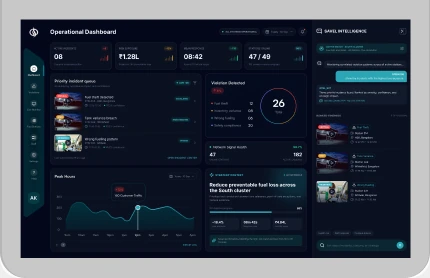
Monitoring operations on one screen
The dashboard puts headline figures, a trend and individual records within the same operational view.
A reading order for live information
A strip of figures runs across the top of the main panel. Lists and a trend chart occupy the centre, while the right column holds a separate activity feed. The dark background and restrained accent colours help distinguish these groups.